Online Tree Map Chart Tool
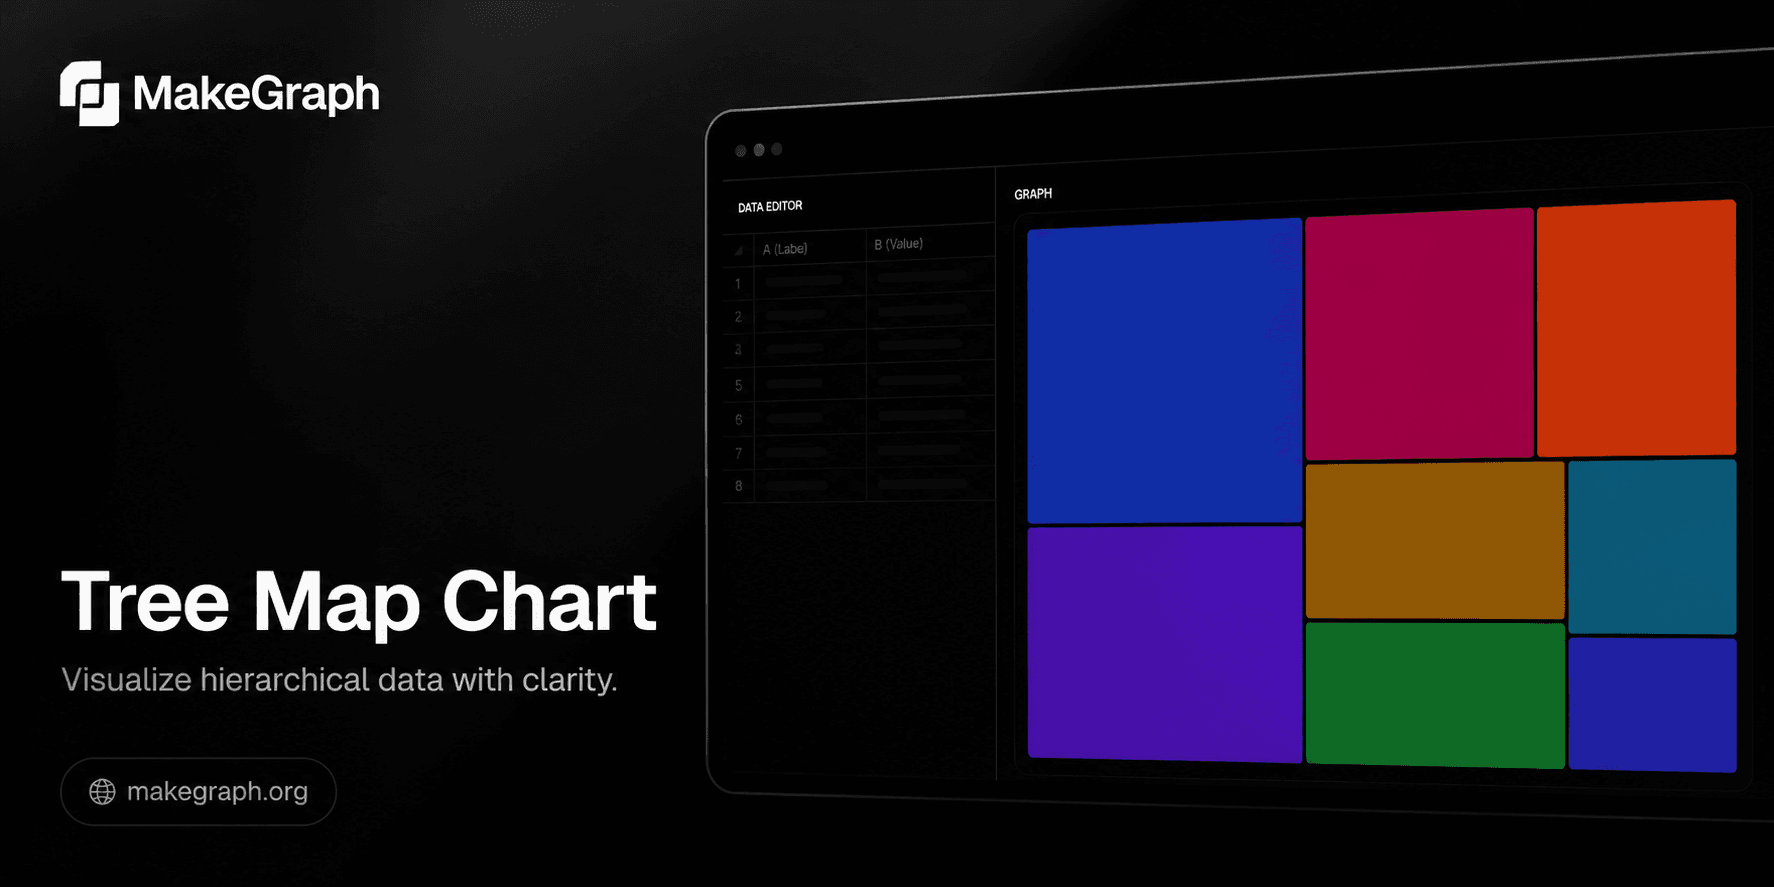
Free online tree map chart maker. Compare part-to-whole values with nested rectangles, customize labels and color, and preview the layout instantly.
All blocks use shades of the theme color.
Why It Works
A tree map turns large category lists into a compact area chart that makes size differences obvious without scrolling through a long table.
See which categories dominate the total by comparing rectangle area instead of scanning many rows of numbers.
Fit more categories into one view than a regular bar chart when dashboard space is limited.
Use the layout to highlight concentration, long-tail categories, and relative contribution at a glance.
Product Highlights
Rename categories and update values directly in the editor without leaving the chart workflow.
Adjust numbers and immediately see how the rectangle sizes rebalance in the preview area.
Toggle category labels, value labels, and tooltips based on how much detail you want to show.
Change the chart title, metric label, and theme color while keeping the editor usable on desktop and mobile.
Common Use Cases
Show how a total budget is allocated across teams, products, or cost centers.
Compare website traffic share by channel, campaign, or content group.
Visualize sales contribution by product line, brand, or region in one compact view.
Summarize portfolio, inventory, or asset composition where share matters more than trend.
Highlight which departments or categories dominate a limited resource pool.
Present long-tail category distributions without stacking many bars into one chart.
Your main question is how much each category contributes to the total.
You need to fit many categories into a compact dashboard area.
Readers care more about relative size than exact axis positions.
You want to reveal concentration, dominance, or imbalance across categories.
You need precise comparisons between close values and a bar chart is easier to read.
You want to show change over time and a line chart fits better.
You only have a few categories and a regular bar chart is simpler.
You need to emphasize sequence, ranking order, or exact axis values instead of area.
Frequently Asked Questions
A tree map chart is best for showing part-to-whole relationships when you have many categories and want to compare their relative size in one compact view.
A bar chart compares categories along a shared axis, while a tree map compares them by area. Tree maps save space, but bar charts are usually better for precise comparisons.
Yes. Tree maps work well with raw values or percentages as long as each value represents part of a larger whole.
It becomes harder to read when you have too many tiny categories, very similar values, or labels that need exact ordering and precise comparison.
Usually yes. A tree map is most meaningful when each rectangle represents a share of the same overall total.
This tool focuses on fast data entry, instant preview, and lightweight customization so you can build a clean tree map without a heavier spreadsheet workflow.
Ready To Start
Enter your category values, adjust labels and color, and use the live preview above to turn a dense table into a compact part-to-whole chart.